The Great Plains Institute is working with cities, counties, and regional governments to routinely incorporate energy planning into local policies, plans, and regulations. To address local energy issues, local governments must first understand community energy use and anticipate how energy resources, markets, and technologies evolve over time.
Planning for a community’s energy future requires understanding the existing conditions of local energy use and recognizing the valuable local energy resources for which there are, or will soon be, development opportunities.
Due to changes in energy technology and markets, local energy resources (e.g., wind, solar, biomass, and energy efficiency) are now economically valuable resources; resources that the private sector will want to develop.
Moreover, many cities and counties are also now setting local energy or climate goals to achieve economic development, environmental, or energy independence outcomes.
Understanding Local Energy Use
Cities and counties need access to local energy data to set community energy use benchmarks and plan for appropriate energy development opportunities. The type of energy information that most communities use in planning for energy development or meeting local energy or climate goals includes the following:
- Utility energy data (electricity and natural gas use in the community)
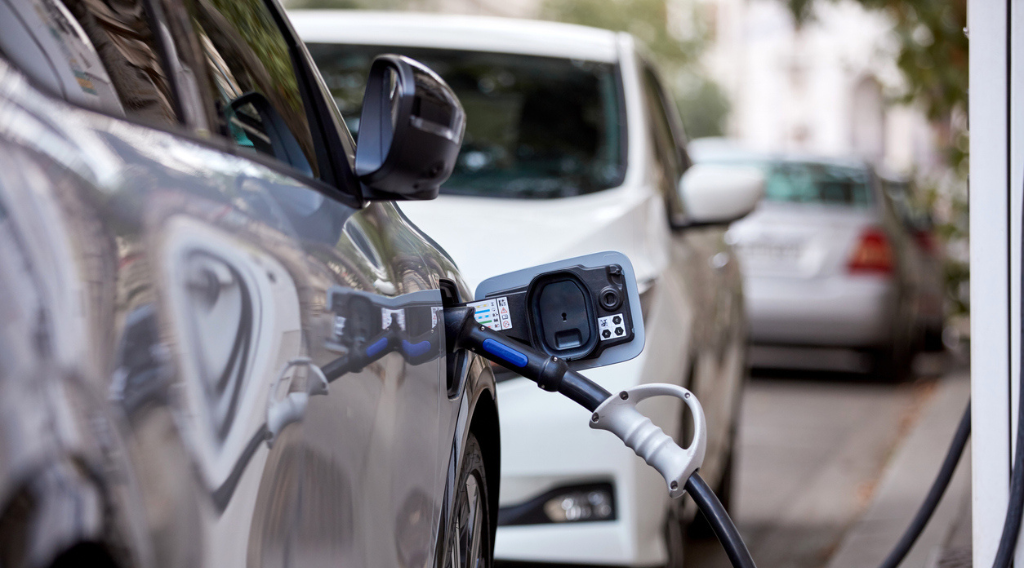
- Transportation energy (primarily gasoline and diesel use for vehicles traveling within city limits)
- Non-utility heating fuels (primarily oil and propane use provided by private sector vendors)
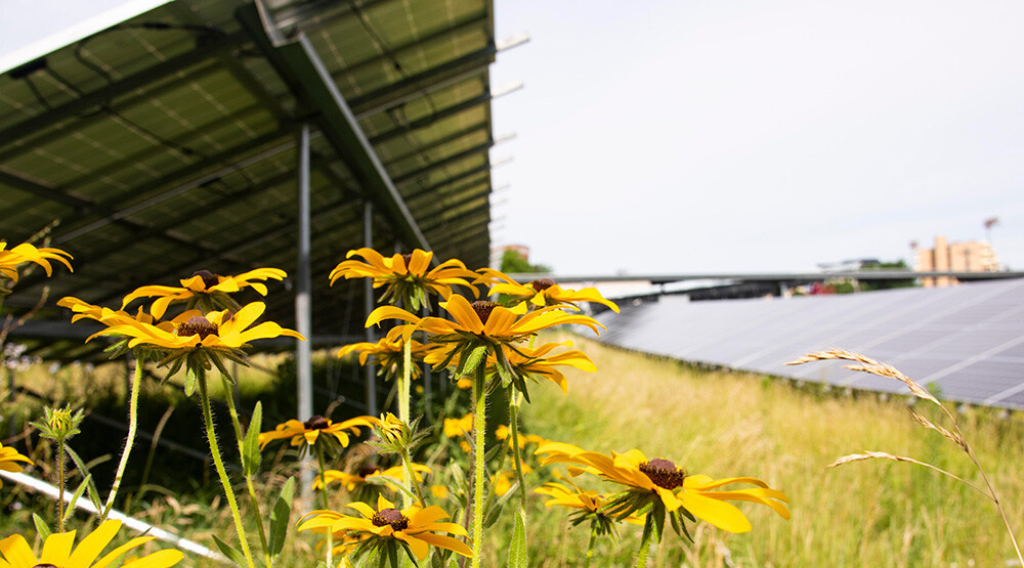
- Solar energy resources (the amount and locations of economically viable solar energy within city limits)
- Wind energy resources (the amount and locations of economically viable wind energy within city limits)
- Biomass energy resources (the type and amount of biomass within the city, such as wood waste, agricultural or industrial byproducts with energy value, and solid waste that has energy value)
- Waste heat (industrial or institutional sources of heat that is released into the air, water, or earth)
Of these information sets, utility energy (electricity and natural gas use), is probably the most important. Utility energy use is the largest energy use in most communities and frequently the most difficult for local governments to acquire.
Local governments have a variety of options for acquiring data on community energy use. Below, we provide some examples of how GPI looks to a variety of data sets to set community energy use benchmarks for cities and counties in Minnesota and other parts of the Midwest. Some of these information sets are only available for specific regions, states, or utilities, but many areas of the country have similar data sources.
A number of private companies keep community energy estimates or acquire energy data for sale to interested parties. We did not investigate these options, but communities should know that such options exist.
The Power of Energy Data: Minnesota Example
GPI is using the following sources of utility energy data, along with other data sources, to assist communities participating in GreenStep Cities, a voluntary challenge, assistance, and recognition program to help cities achieve their sustainability and quality-of-life goals. GPI provides GreenStep Cities with summaries of their community energy use data, potential for energy efficiency, and estimates or measurements of other local energy resources (e.g., solar, wind, and biomass).
Sources for community utility energy use (electric and natural gas) – national
- Cities Leading through Analysis and Planning (Cities-LEAP, National Renewable Energy Lab (NREL) State and Local Energy Data estimates). This local energy data set is the most complete set of energy data, (for both utility and transportation data) and is available to 23,000 cities in the US. These City Energy Profiles provide an estimate (not actual measured data from the utilities) of electric and natural gas energy use. The estimate of community energy use is derived via a statistical model based on common community characteristics, and has been tested for validity across a number of cities. The average accuracy of the estimates is good and provides a useful starting point for additional analysis and energy planning. However, the accuracy for individual cities varies widely. Cities should consider Cities-LEAP utility energy use data as a representation of energy usage for a cohort of similar cities, rather than an estimate of their city. The website also includes a great deal of other data, including a calculation of the fleet efficiency of light duty vehicles registered in each city (see example below), commercial building square footage by type of land use, and estimated solar energy generation potential for smaller buildings.

Source: NREL, City Energy Profiles
- National Utility Energy Registry (in development). A collaboration of several states is now underway to create a National Utility Energy Registry where utilities can voluntarily upload community energy data for use by cities or others who are working on energy at the community level. Led by the State of New York, four states (New York, Maryland, District of Columbia, and Minnesota) are piloting use of a unified standard for reporting community-level utility energy data. New York should have most local governments covered when it launches the effort this year. Several other states are compiling the data and hope to eventually upload it to the national registry. GPI is the Minnesota project lead, with support from LHB and the Minnesota Department of Commerce.
Sources of utility energy use data – state and utility
- Utility Energy Reports – Xcel Energy Community Energy Reports. In Minnesota and Colorado, Xcel Energy provides Community Energy Reports to any city that requests the information. These data are the most accurate and complete source on local energy use for those communities. Xcel currently provides data for cities in most of its eight-state service territory. The most complete states are Minnesota (74 cities and counties) and Colorado (65 cities and counties). The data is only for Xcel-provided energy; some communities lie in the service territory of more than one utility and need to acquire data from other utilities to get a complete picture of community energy use. Xcel provides annual data on energy use by type of fuel (electric and gas), and by customer class (residential, commercial, and industrial). Xcel also provides information on the number of people participating in energy efficiency programs, demand response programs, and renewable energy purchasing and number of renewable energy installations.
Below are two examples of how this data can be used by communities:


- Xcel Energy also offers cities an opportunity to participate in the Partners in Energy (PiE) program to make an even more detailed assessment of energy conditions, engage the community, develop an energy plan, and set priorities for capturing energy efficiency and other local energy resources. Up to six communities per year can participate in this program.
- State Sustainability Programs – Regional Indicators Initative (RII): RII utility energy and travel energy data is currently available for 25 cities in Minnesota. These data are longitudinal (from 2007-2013, and some communities have 2014 or 2015 data). The RII data includes complete utility energy data and provides estimates of community greenhouse gas emissions that are consistent with the Global Covenant of Mayors greenhouse gas protocols. By the fall of 2018, the RII database will be expanded, targeting GreenStep Cities at Step 2 or higher. Two examples below show how this data was used in Minnesota communities.

![]()
In Minnesota, the Regional Indicators Initiative (RII) is a program affiliated with the GreenStep Cities program. The program has compiled data from utilities and other sources on a city-by-city basis. There are 12 other states with statewide local sustainability programs, some of which compile energy data to assist cities with sustainability and clean energy initiatives (refer to the National Network of Statewide-Local Sustainability Organizations, N2S2O, to see states with such programs). Utility energy and travel energy data is currently available for 25 cities in Minnesota. These data are longitudinal (from 2007-2013, and some communities have 2014 – 2017 data). The RII data includes complete utility energy data and provides estimates of community greenhouse gas emissions that are consistent with the Global Covenant of Mayors greenhouse gas protocols. By the fall of 2018, the RII database will be expanded, targeting GreenStep Cities at Step 2 or higher. Two examples below show how this data was used in Minnesota communities.

- Public utility commission or state energy office utility data. Utilities must annually report energy sales and other energy information to the US Federal Energy Regulatory Commission, the state public utilities commission, and/or the state energy office. Regulatory files contain a great deal of information, although finding and deciphering it can be troublesome. In Minnesota, the Public Utilities Commission and the Department of Commerce track a great deal of information that can be useful to a city in acquiring or estimating community-wide utility energy use. In Form 7610 filed with the Minnesota Department of Commerce, utilities provide annual energy sales for electricity and natural gas by customer class and by some geographic regions. For cities with municipal energy utilities, the utility service territory boundaries are frequently co-terminus (i.e., very close) with city limits. These data thus enable cities to acquire fairly accurate community-wide energy information from these reports, or directly from the utility. For communities that are served by co-operative or investor-owned utilities, the Minnesota reports do not break out data by city, but do identify total energy sales for electric and gas by county. The county data is not disaggregated by customer type, but can still provide a baseline for energy use, and customer class breakouts can be imputed from other data in the report. Data must be downloaded separately for each year.
- Direct requests to utilities by cities. Most utilities can provide, upon request, community-wide energy information broken down by year and customer class (residential, commercial, and industrial). Additional information may also be available, such as the number of households or businesses participating in energy efficiency, demand response, renewable energy, or other programs or special rates that the utility provides. GPI has helped cities in the GreenStep Cities program define utility energy data needs and form a request to the utilities that serve the community to identify and provide readily available data on current and history energy use patterns.
As cities increasingly look to take advantage of local energy resources; set energy, climate, and/or sustainability goals; and plan for future development, information on energy use and resources are a valuable tool. Cities have a variety of information sources to take advantage of. There are many sources of data available at the local, state, and national level that communities can use to inform decision making and investments that can benefit their residents.


